Viewing Details about a Machine
When you drill-down to see health information about
a particular machine, what you see depends on the type of machine and
whether data is collected manually with a TRIO or online with a SPRITE
data acquisition device via the WATCHMAN Online System.
Note: If you
have arranged for on−request reviews
by an Azima analyst, an orange WATCHMAN Expert Review button ( ) appears on this page.
When you click it, you are prompted to confirm your request. Click Yes, to send an email
to Azima; click No to cancel the
request. This button also appears in the Report Editor in ExpertALERT
at the WATCHMAN Data Center.
Data Acquired with TRIO Data Collector
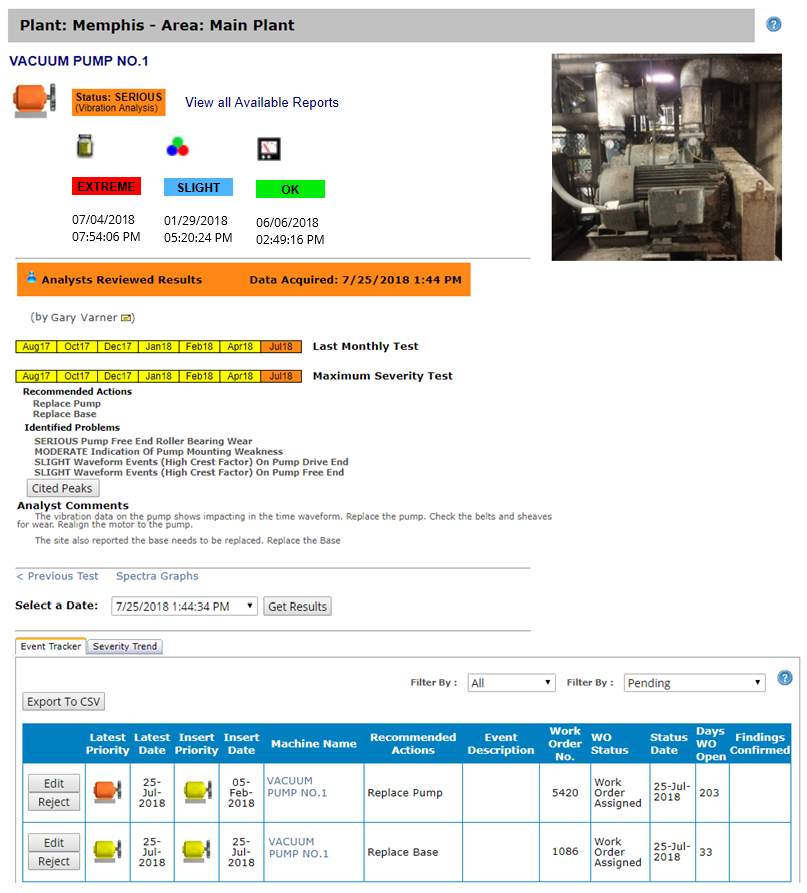
The following image shows the Machine Details page
for a pump from which data was collected with a TRIO.
Each section
of the page is described in the table below.
When viewing the Machine Details page for a machine
from which data is acquired with a TRIO, you will see some or all of the
following:

The gray
bar at the top of the page shows the plant and area in which
the machine resides. The name
of the machine is listed below the gray bar. Next to it is
a plus sign button  -- click it to add this
machine to your Watch
List. -- click it to add this
machine to your Watch
List. The icon
color represents the state of the machine based on the last
time an analyst reviewed vibration data (Analyst Reviewed
Results). If
a machine
identifier was entered for this machine in ExpertALERT
or StandardALERT, it appears directly below the machine's
name. (The image above does not show a machine identifier.)
Machine Identifiers typically are used when the machine name
does not match the identifier used by your Computerize Machine
Management System (CMMS). You can export data from ALERT to
CMMS using the machine identifier to map them. If
any reports are posted for this machine, a View
all Available Reports link appears, click it to see
them. In order to be accessible from here, the report must
be posted to a UDP associated with this machine. |
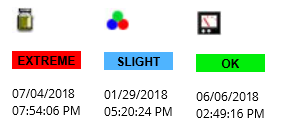
If there are technology
reports posted (IR, thermography, etc.), you will see the status
assigned to the most recent report of that type. To access these
reports, click the View all Available
Reports link (described above).
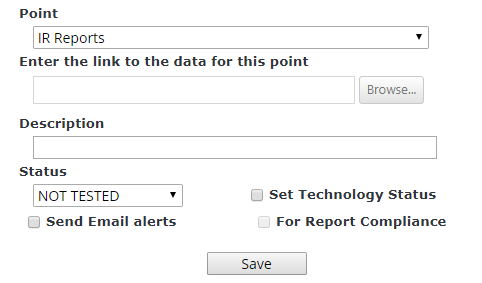
When posting a report,
the person must select the Set
Technology Status check box in order for to be shown here.
The type
of UDP created (oil, IR, etc.) determines the technology.
A similar check box is available in ExpertALERT-Cloud for analysts who
post reports from the diagnostic software.
|

The Analyst
Reviewed Results banner shows the date and time the data was
acquired, with the name of the analyst who performed the diagnostics
below it. If more than one analyst reviewed the data, both
names appear. The color of the banner represents the state
of the machine based on the last analyst review.
Tip! If
you have an email client set up, you can click the name of your
analyst to send an email.
The Last Monthly Test bar shows
the last six months in which there was a reviewed test. If
multiple tests were performed on the machine within a given
month, the status of the most recent test is shown. If
there are not six months in which at least one test was taken,
there will be fewer bars. The month/year in each bar identifies
the date of the data reviewed. The Maximum Severity Test bar
shows the severity of the most severe fault detected during
the past six months in which there was at least one reviewed
test. The statuses shown may differ from the Last
Monthly Test bars because they represent the most severe
fault in each month instead of the status of the latest reviewed
test. This can be helpful if you have had more than one set
of data collected within a collection period and want to see
if any detected faults were more severe than the last reviewed
test.
Special tests capture
via the More Data button
of a TRIO are not included in either the Last
Monthly Test or Maximum
Severity Test bars. |

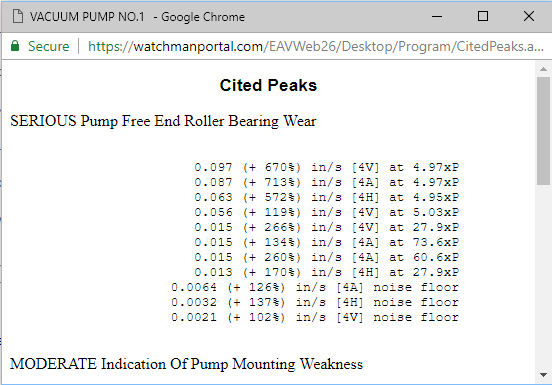
The actions recommended by your
analyst (Recommended Actions)
and the faults detected (Identified
Problems) are listed below the bars. Click the Cited
Peaks button to open a new window showing the cited
peaks for each Identified Problem.
|

If
your analyst added any comments about his or her findings, they
appear an Analyst Comments
section. |

When you view details
about a particular machine, you can view vibration
and/or process
point data in graphical format. To see the graphs, click the
Spectra Graphs and/or
Process Point Graphs link.
The data available determines whether you see these links |

Use
the Select a Date drop-down
list to select the date of the data you want displayed, and then
click Get Results. The
top of the page will display the Analysts Reviewed Results and
Analyst Comments (if any) for the selected date.
When
viewing results from an earlier date, a Next
Test > link appears next to the <
Previous Test link above the drop-down list so you can
move through the data. |
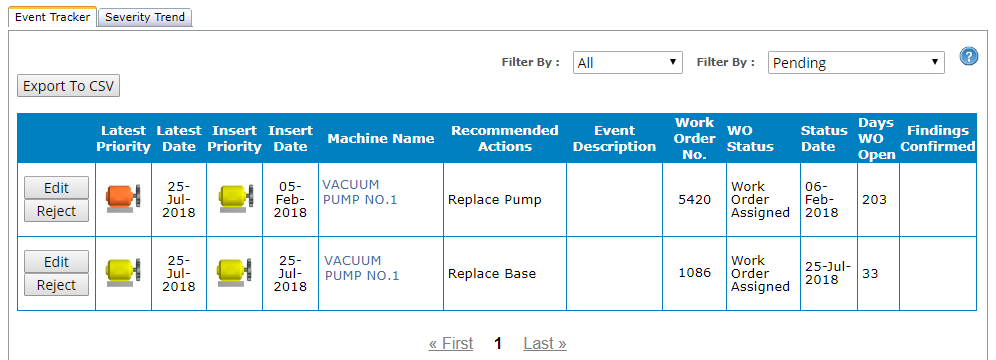
The
Event Tracker for this machine appears at the bottom of the Machine
Details page. It contains all of the same information and functions
exactly as the Event
Tracker at the database, plant, and area levels--it
just contains events only for the selected machine. |
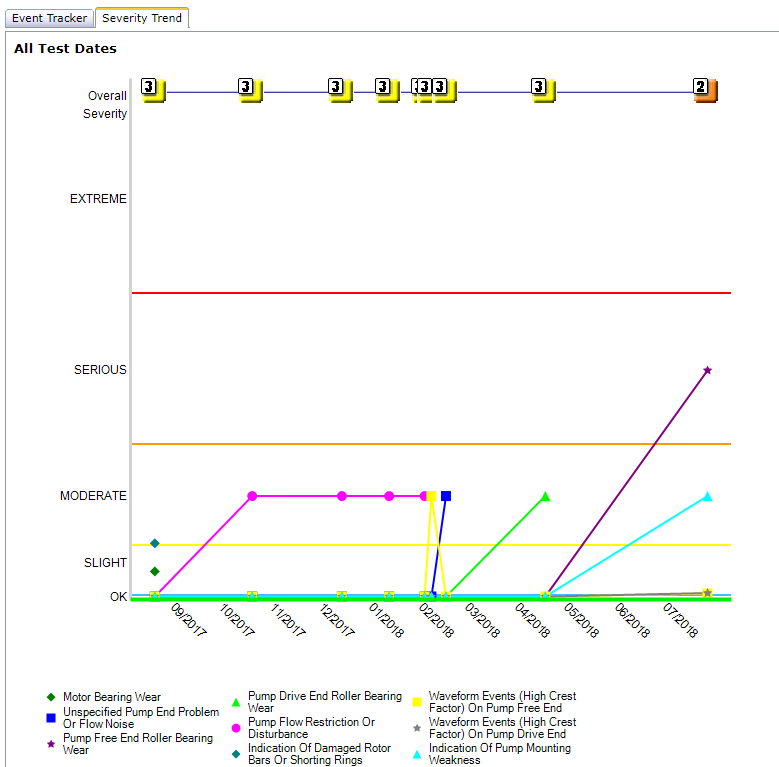
The
Severity Trend tab plots
all faults called for this machine and their severity. All available data is displayed for machines from which
data is collected with a TRIO.
If you want to control the date range of the information
represented in the graph, specify a range via your Trend
Preferences.
For
machines from which data is collected with a TRIO, only Analyst
Reviewed Results are plotted. |
Data Acquired with a SPRITE Data Acquisition Device
The following image shows the Machine Details page
for a compressor that is monitored online with a SPRITE data acquisition
device as part of the WATCHMAN Online System.
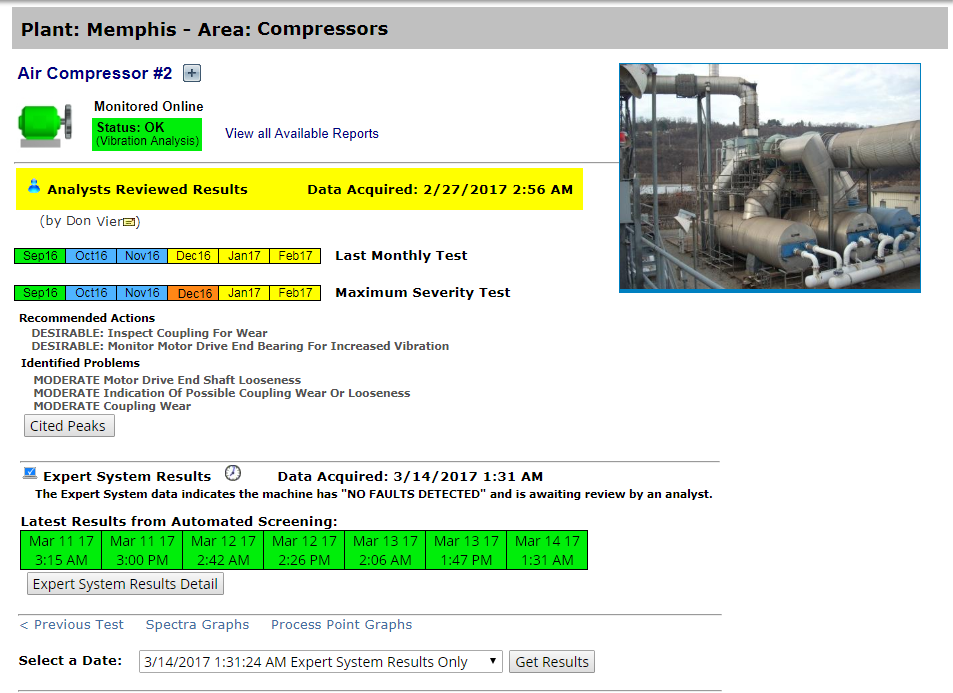
Each section of the page is described in the table
below.
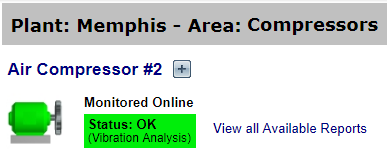
The
gray bar at the top of the page shows the plant and area in
which the machine resides. The
name of the machine is listed below the gray bar with "Monitored
Online" designating it as being part of the WATCHMAN
Online System. Next
to the machine name is a plus sign button  -- click it to add this machine to your Watch
List.
 The
icon color represents the state of the machine based on the
latest reviewed test. This could be based on Expert System
Results or Analyst Reviewed Results, whichever is newer. If
an reports are posted for this machine, a View
all Available Reports link appears, click it to see
them. In order to be accessible from here, the report must
be posted to a UDP associated with this machine. If
there are technology reports posted (IR, motor testing, etc.),
you will see an icon for each one, along with the status assigned
to the most current report of that type. To access these other
technology reports, click the View
all Available Reports link. (These icons are not shown
in the image above, but you can see them in the manually monitored
machine example at the top of this topic.) |

The Analyst
Reviewed Results banner shows the date and time the data was
acquired, with the name of the analyst who performed the diagnostics
below it. If more than one analyst reviewed the data, both
names appear. The color of the banner represents the state
of the machine based on the last analyst review. The information
in this section does NOT reflect expert system results.
Tip!
If you have an email client set up, you can click the name of
your analyst to send an email.
The
Last Monthly Test bar shows the last six months in
which there was a reviewed test. If multiple tests were performed
on the machine within a given month, the status of the most
recently reviewed test is shown. If there are not six
months in which at least one test was taken, there will be
fewer bars. The month/year in each bar identifies the date
of the data reviewed. The Maximum Severity Test bar
shows the severity of the most severe fault detected during
the past six months in which there was at least one reviewed
test. The statuses shown may differ from the Last
Monthly Test bars because they represent the most severe
fault in each month instead of the status of the latest reviewed
test. This can be helpful if you have had more than one set
of data collected within a collection period and want to see
if any detected faults were more severe than the last reviewed
test.
Special tests capture via the More
Data button of a TRIO are not included in either the Last Monthly Test or Maximum
Severity Test bars. |

The actions
recommended by your analyst (Recommended
Actions) and the faults detected (Identified
Problems) are listed below the bars. Click the
Cited Peaks button
to open a new window showing the cited peaks for each Identified
Problem.
Important!
These faults and actions are based on the last analyst review
of data. An online machine would likely have newer data with Expert
System Results awaiting analyst review. That information is shown
lower on the Machine Details page. |

If your analyst added any comments about
his or her findings, they appear an Analyst
Comments section. These comments are about the last analyst
review. |

The
Expert System Results section appears if the last automated
screening was performed on data that is newer than what was
used during the last analyst review. The
date the data was acquired is displayed and the most recent
Expert System Results appear just below acquisition date. A
color-coded bar shows the last seven automated screenings
for this machine, as well as the date and time of the data
that was screened. Click
the Expert System Results
Detail button to open a new window showing the detected
issues from the last screening. |

When
you view details about a particular machine, you can view vibration and/or process
point data in graphical format. To see the graphs, click the
Spectra Graphs and/or
Process Point Graphs link.
The data available determines whether you see these links. |
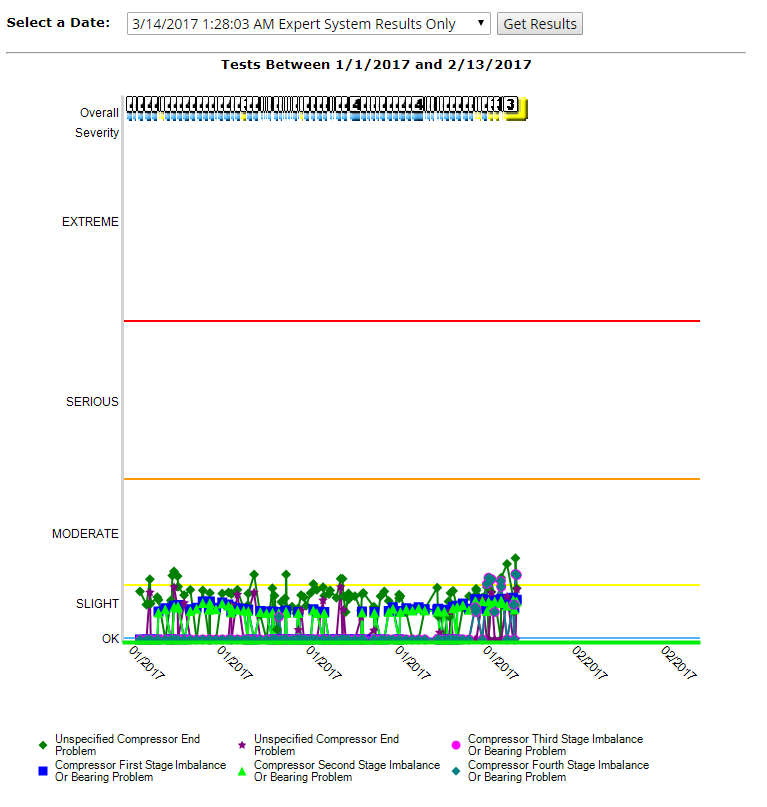
For machines
from which data is acquired online with a SPRITE data acquisition
device, the graph only shows Expert System Results. Use the
Select a Date drop-down
list to select the date of the data you want displayed, and
then click Get Results
to see that data plotted below the drop-down. Data that
has only been reviewed by the expert system have Expert
System Results Only noted. If just a date and time
appears, it means that data has been reviewed by an analyst
(Analyst Reviewed Results). You
can use the Previous Test
and Next Test links
to move through the graphs. By default,
the last 60 days of data is shown. To control how much information
is displayed, set a date range via your Trend
Preferences. |
Related Topics
Viewing
Spectral Data Graphs
Viewing
Process Point Graphs
About
Online Machines
 ) appears on this page.
When you click it, you are prompted to confirm your request. Click Yes, to send an email
to Azima; click No to cancel the
request. This button also appears in the Report Editor in ExpertALERT
at the WATCHMAN Data Center.


