This topic is intended for those who use ExpertALERT-Cloud at the WATCHMAN Data Center to perform analysis and create custom reports for display on the WATCHMAN Reliability Portal. If you simply want to post a PDF report to the Portal -- for example, a data collection schedule you want to make accessible to all of your technicians -- you can do so directly from the Portal.
When an analyst creates a custom report in ExpertALERT-Cloud, it is generally posted to the Portal from that software.
Only those with access to ExpertALERT-Cloud at the WATCHMAN Data Center can generate and post reports in this manner described in this topic. If you think your login should be able to access ExpertALERT-Cloud but cannot, contact your WATCHMAN Reliability Portal Administrator or Azima Customer Support.
Note: The custom reports created by analysts in ExpertALERT-Cloud and posted to the Portal are different from the custom reports that can be generated on-the-fly from the WATCHMAN Portal. The custom reports created in ExpertALERT-Cloud may contain more details (including process data) than that those generated by the Portal. In addition, Azima analysts have more control over the contents of these reports as they are created using ExpertALERT's advanced diagnostic tools and not on-the-fly using a standard template.
Posting a PDF to the Portal from ExpertALERT-Cloud requires the following:
You must have a User Defined Point (UDP) in your ExpertALERT-Cloud database in order for your report to post to the Portal. If the UDP was created in ExpertALERT-Cloud, it must have the Display in Web Portal check box selected. If you created the UDP via the Portal, it is Portal-enabled by default.
Your connection to ExpertALERT-Cloud at the WATCHMAN Data Center must allow you to save to your local drives. If you are not sure if you can do this, contact Azima Customer Support.
You must have a third-party PDF converter installed on your computer so that you can create a PDF prior to posting the report to the Portal.
To create and post a custom report to the WATCHMAN Reliability Portal from ExpertALERT-Cloud
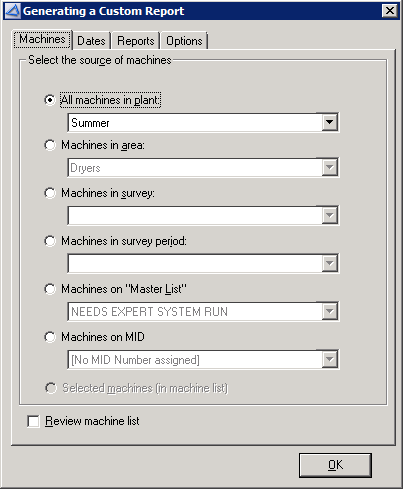
Open ExpertALERT and choose Reports>Custom Reports to open the Generating a Custom report dialog box.
On the Machines tab, do the following:
Specify the machine(s) you want included in the report by selecting the appropriate option button and then making a selection from its associated drop-down list.
If you want to review a list of the machine before the custom report is generated, select the Review machine list check box.
On the Dates tab,specify the dates of the data you want included in the report.
On the Reports tab, do the following:
From the Front Matter group, specify the sections you want to appear at the beginning of the report by selecting the appropriate check boxes.
From the Analysis group, select the options you want included in the report.
IMPORTANT! Select the Print preview check box. This previews the report before it is printed so you can save a copy.

If you selected the Graphs check box on the Reports tab, an Options tab appears. Select it and specify the types of graphs you want included as well as specify other report parameters (such as thicker lines for spectra).
Click OK.
On the Additional Selections dialog box, do the following:
Select the Standard Azima Reports option button.
In the Report sections group, select the sections you want included in the report (such as a Problem Summary).
In the Preferences section, select the other items you want included (such as machine images, process points, etc.)\
In the Include tests with/Include graphs with sections, specify the range of faults you want to include.
If you selected the Report Details and/or Report Synopsis check boxes from the Report sections group, decide whether you want to specify a date range and/or include the synopsis with modified counts. If you want to specify a date range, select the Date range for Details/Synopsis section check box, then use the To and From drop-down lists to specify the range. If you want to use modified counts, select the Include Synopsis with modified counts check box.
In the Priority wording section, specify whether you want custom or ExpertALERT standard text used to identify priority levels.
Click OK.

Wait while the report is opened in Microsoft Word. This may take a moment depending on the number of machines and amount of information included in the report.
Save the report to a drive on your local computer and edit it at your leisure. DO NOT save it to the WATCHMAN Data Center server.
Once you are satisfied with the content of the report, create a PDF and make note of its location on your local machine.
Open ExpertALERT-Cloud and select the User-Defined Point (UDP) to which you want to save the report.
Choose File>Add data to user-defined point.
On the New User-Defined Point Data dialog box, do the following:
Click the Browse button and navigate to the PDF of the report, then click Open. When the path to the PDF appears in the box, you will notice that the date and time change to match the timestamp on the file.
In the Description box, type a description of the report. This description will appear as the report summary on both the WATCHMAN Reliability Portal and in ExpertALERT.
If you want emails sent to Portal users who have email notifications set up, select the Send email alerts check box.
If you selected the Send email alerts check box, the Report compliance check box is enabled. Select it if this is a vibration report that satisfies a requirement relative to reporting. You would select this if you are contractually obligated to produce a vibration report within a specific time span. For those with report due/overdue email notifications set up, selecting this check box and posting within the required time span keeps a "report overdue" reminder from be sent out. (This feature only applies to vibration.)
From the Status drop-down list, select a severity for the report based on the importance of its content. The status will be reflected on the Portal via so users can identify reports that may contain critical information. The report description will be highlighted with the color that corresponds to the status you select. Keep in mind that this status does not change – it is a fixed state associated with a static report. If a subsequent report shows a healthier status, the new posted report shows the improved status
If you are posting a report to a technology UDP that is at the machine level, the Set Technology Status check box appears. Select this check box to enable technology filtering. (Technology UDPs are Vibration Analysis, Oil Analysis, Motor Testing, Thermography, Ultrasonic, Recip Analysis, Battery Testing, Visual Inspection, or Performance Metrics).
Click the Save
and exit button  . The report will be
posted to the Portal and will be saved in your ExpertALERT database.
. The report will be
posted to the Portal and will be saved in your ExpertALERT database.
