In addition to the reports listed in the Reports section of the WATCHMAN Reliability Portal, you can also generate your own reports on-the-fly and then save them to your local computer, print them, and/or post them to the Portal.
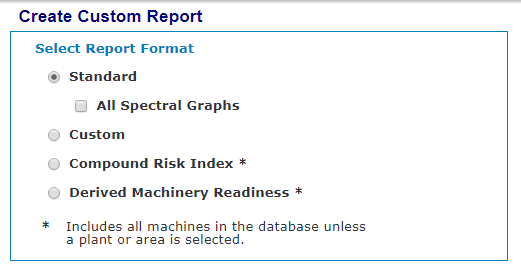
When creating a custom report, you can choose from four types of reports: Standard, Custom, Compound Risk Index, and Derived Machinery Readiness.
If you plan to save a report, it will be saved as a PDF. You and anyone to whom you plan to distribute it must have a PDF reader, such as the free Adobe Reader, in order to open the file.
To create a custom report
From any Portal page (except the Dashboard), click the Create Custom Report link in the top banner.

IMPORTANT! If you are prompted to install or enable ActiveX, do so as it is required for access.
In the Select Report Format section, select the type of report you want to generate: Standard, Custom, Compound Risk Index, Derived Machine Readiness. Each type of report is described here. If you select Standard, you can optionally select the All Spectral Graphs check box to include spectral graphs in the report.
Tip! If you select the Compound Risk Index or Derived Machinery Readiness option button, you can get a report for the whole database, an entire plant or an entire area. These reports use current machine status information and operational significance values to provide timely and valuable business level metrics related to the risk of machinery problems to plant/area operations and readiness of a group or groups of machines.

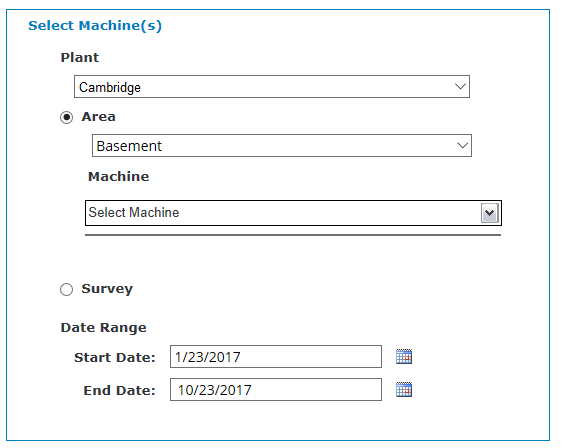
In the Select Machine(s) section, specify the machines you want included in the report. The report format selected in the previous step determines the options available here. All reports let you specify a plant or area; Standard and Custom reports let you specify a survey and a date range for data (in mm/dd/yyyy format). This section is dynamic; as you make selections the drop-down lists contain only relevant options. For example, in the image below, if you selected the Area option button, a drop-down list containing only the areas in Cambridge plant appears.

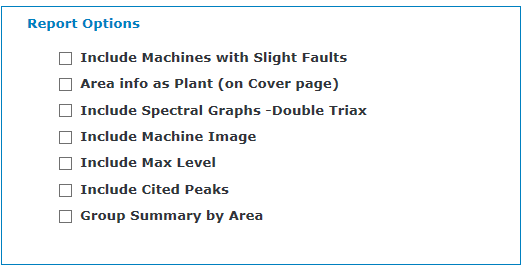
If you selected the Custom option button in Step 2, customize your report by selecting the features you want included in the report. This list of check boxes varies depending on whether you are basing the report on a plant, area, or survey.

Click Get Report.
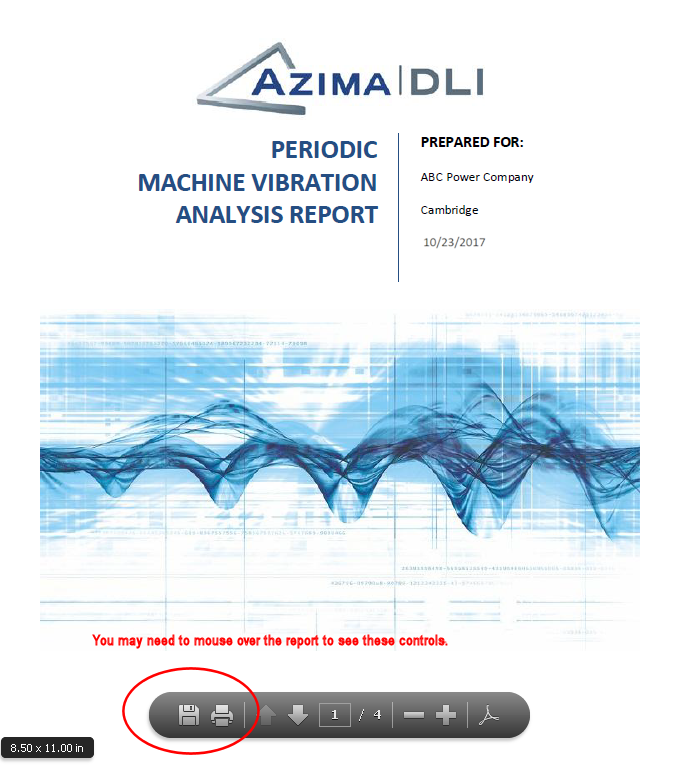
Wait while the report is generated. Once displayed, you can do any of the following. You may need to mouse-over the report to see these icons.
To print the report, click the Print icon. If you have a printer installed, the Print dialog box will open so that you can print the report. (You must have a printer installed in order to print the report.)
To save the report, click the Save icon and specify a location on your local computer to save it.
To post the report to the Portal, click the Save icon, specify a location on your local machine to save it, and then follow the instructions for posting a report to the Portal via the Portal itself.
Note: If you do not want to print or save the report, you can review it and then close it. It will not be saved.
