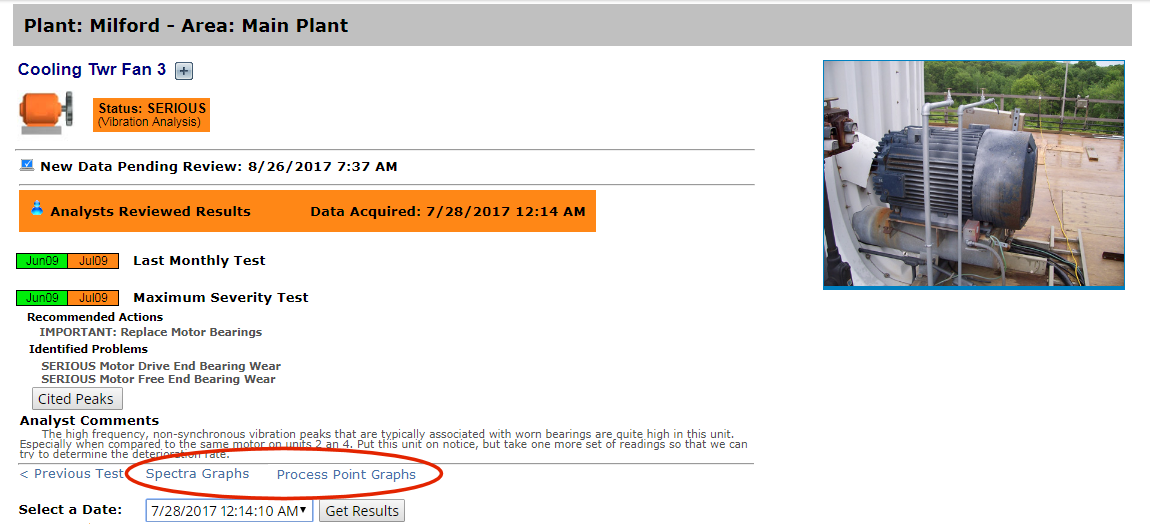
When you view details about a particular machine, you can view vibration and/or process point data in graphical format. To see the graphs, click the Spectra Graphs and/or Process Point Graphs link on the Machine Details page. The data available determines whether you see these links.

If vibration data has been collected for a machine, a Spectra Graphs link appears on the Machine Details page. The Spectra Graphs link does not appear for machines that have never had any data collected.
![]()
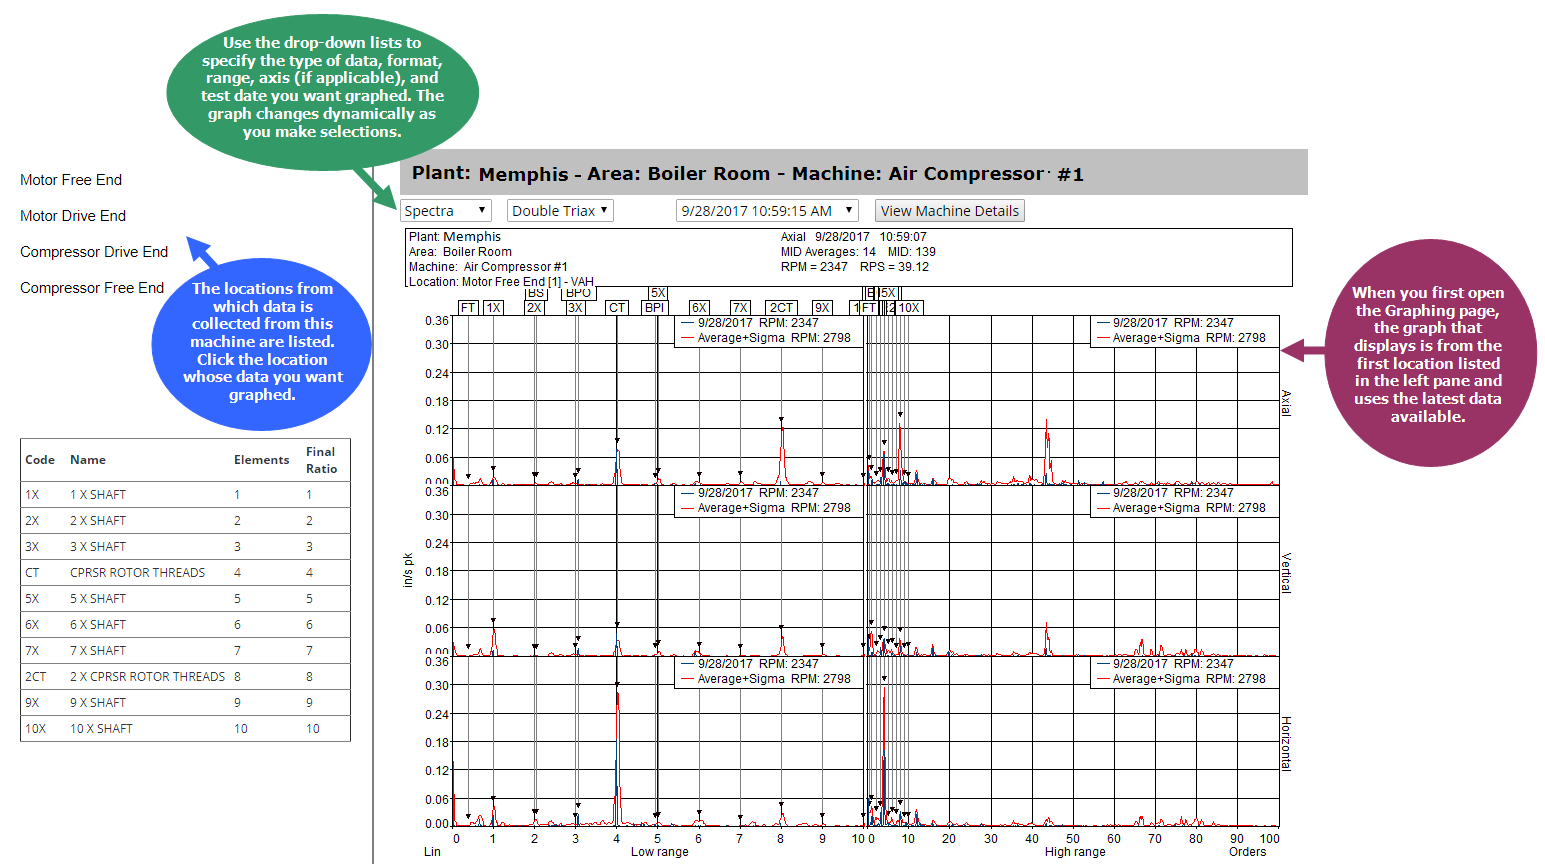
Click the Spectra Graphs link to open the latest reviewed test data in graphical format. A series of drop-down lists across the top of the graph lets you change the display based on your preferences. For example, you may want to graph data from a previous collection or you may want to view it in double-triax format instead of single-axis.
The types of data you can graph (spectra, waveform, demodulated, overall) depends on the location from which data was collected and the collection settings set up by your analyst. Only the types of data available appear in the drop-down list. All of the drop-down lists are dynamic and only show options that can be graphed based on your previous selections.
In many cases, vibration data is collected from more than one location on a machine. In this case, each location is listed to the left of the graph. Click the location whose data you want graphed.
Once you have made your selections and the graph you want is displayed, you can print it by clicking the Print Screen link in the top menu.

If at least one process point has been added to the database for a particular machine (for example, speed), a Process Point Graphs link appears on the Machine Details page.
![]()
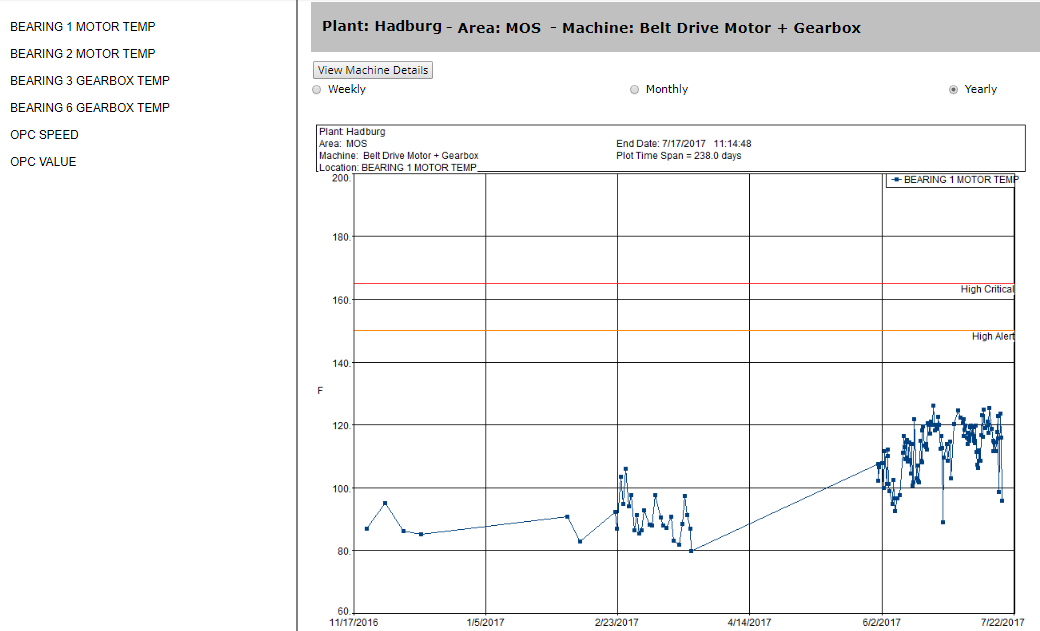
Click the Process Point Graphs link to see graphs of the data from the process point(s) associated with the machine. Process point data is typically speed, load, temperature, vibration from a panel trip system, or other scalar measurement.
Note: The Process Point Graphs link appears when data is available from within the past year.
If more than one process point is associated with a machine (for example, speed and temperature), each will be listed to the left of the graph. Click the process point for which you want data graphed.
You can change the view of the graph to display data from the past week, month, or year, with the current data used as the starting point. If no data exists for the period you specify (for example, you select the Weekly option button and data was not collected this past week), a "No data to graph" message appears.
If your analyst set alarms in ExpertALERT for this process point, the High Critical, High Alert, Low Critical, and Low Alert thresholds will appear on the graph (if they fall within the range of the display).
