
All available Dashboard elements are described below. The quality and importance of these elements grow as your program matures. For example, the element showing the top five root causes at your plant(s) becomes more meaningful as more faults are detected and confirmed.
Several elements are directly tied to your use of the Event Tracker.
In most cases, the information presented is relative only to the plant selected from the drop-down list in the upper right of the Dashboard. If All Plants is selected, then the information is combined for all plants.
Note: The My Watch List element is not impacted by your selection. It always shows all machines added by you, regardless of the plant selected from the drop-down list.
The following is a complete list of all available elements. Click a link to jump to detailed information about that element.
The Quick Views element provides three buttons that let you quickly access key information about your PdM program. It also shows the user name of the currently logged in user. (You can ask Azima to customize this element with your corporate logo above the user name.)
Plant View / Program View - If the Dashboard is filtered to a single plant, a Plant View button appears so you can open the Plant View page for the selected plant. If the filtering drop-down at the top of the page is set to All Plants, a Program View button appears so you can access the Program View page to see an overview of all of the monitoring across all of your plants.
Event Tracker - Click this button to open the Event Tracker. If the Dashboard is filtered to a single plant, the Event Tracker for that plant opens. If the filtering drop-down at the top of the page is set to All Plant, the Event Tracker for the entire database opens.
Machines By Severity - Click this button to generate a list of all machines ordered by severity, with those with at least one Extreme fault appearing first. How your Dashboard is filtered determines whether you will see all machines in a particular plant or all machines across all of your plants.
Recent Analysis Results - Click this button to see the last 20 reports posted for the selected plant or across all of your plants. How your Dashboard is filtered affects the list shown.
Find Machine Name/Identifier Like - Enter a term in the box and click Find (or press the Enter key on your keyboard) to search for machines that contain that term in its machine name or identifier. If the Dashboard is filtered to a particular plant, this tool only searches that plant. If the Dashboard is filtered to All Plants, this tool searches all plants. A drop-down list lets you specify whether to search by machine name or identifier.
Find Machine Name Like - Select this if you plan to enter a full machine name (DWW #2 Pump) or partial name (pump). If you enter an exact machine name, it opens the Machine Detail page for that machine. If you enter a partial name, it generates a list of machines containing the term.
Find Machine Identifier Like -- Select this if you plan to enter a full machine identifier or part of one. If you enter an exact machine identifier, it opens the Machine Detail page for that machine. If you enter a partial identifier, it generates a list of machines containing those characters.
Note: "Wildcards" are automatically inserted before and after the entered search term. This means the term can be anywhere in the machine name or identifier.

Use this element to customize a list of machines to which you want quick access.
Typically, these are your most critical and/or problematic assets whose health status you want to review quickly and frequently. Machines appear in order of severity with those deemed Extreme appearing at the top.
Be sure to note the following:
The
color-coding of each machine (![]() ) is
based on the last Analyst Reviewed Result. If newly collected vibration
data is awaiting review, it is noted and the machine name is preceded
with the following icon:
) is
based on the last Analyst Reviewed Result. If newly collected vibration
data is awaiting review, it is noted and the machine name is preceded
with the following icon: 
If there are other technologies associated with the machine (oil, thermography, etc.), they are listed below the vibration information and show the date the last report was uploaded to the Portal and the status assigned to it by the person posting it. The statuses of technologies other than vibration DO NOT affect the machine status indicated by the machine icon. The color of this icon is the vibration status from the last time an analyst reviewed the vibration data.
Machines that are monitored online with the WATCHMAN Online System have "Monitored Online" below the plant/area in the upper left corner. Because SPRITE data acquisition devices are always gathering new data and running it through the expert system, the most recent Expert System Status is shown in addition to the Last Reviewed Vibration Status. Often, the Expert System Results will be newer, as analysts only review data on a schedule and/or when the expert system detects a notable change.
Click here to learn how to create and use the My Watch List element.
This is the only element that is NOT impacted by how the Dashboard is filtered. All of the machines you add to the list always appear, even if you filter the Dashboard to a single plant for which there are no My Watch List machines.

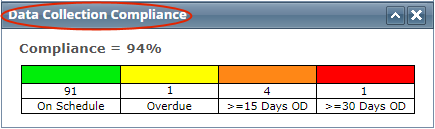
This element calculates a data collection compliance percentage so you know whether the machines in your program are being tested on schedule. A table below the percentage shows how many machines are on schedule with their collection and how many are overdue (and how overdue they are).
The information shown is either relevant to a single plant or across all of your plants, depending on how your Dashboard is filtered. Only machines from which data is collected manually with a TRIO vibration data collector are included in this element. Machines monitored via the WATCHMAN Online System are not factored into this compliance element.
Click the Data Collection Compliance title bar to generate an Overdue Machines report for the plant (or all plants).
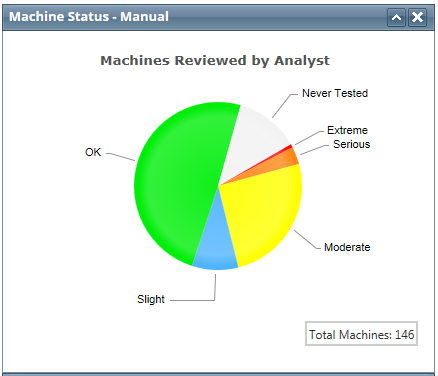
Machines from which data is collected manually with a TRIO data collector and reviewed by an analyst are summarized in this section. A pie chart and associated color-coded legend show how many machines are in each state of health. Click the Machine Status - Manual link in this element's title bar to generate a report showing all of the manually monitored machines in order of health status, with the most severe appearing first. This pie chart shows the status from the last analyst review. This means that if data has been collected, but not reviewed by an analyst, that data is not represented in the chart (even if it has been run through the expert system).
How your Dashboard is filtered determines whether this pie chart represents machines from a single plant or from all of your plants.
Machines from which data is automatically collected by the WATCHMAN Online System are summarized in this section. A pie chart and associated color-coded legend show how many machines are in each state of health. Click the Machine Status - Online link in this section's title bar to generate a list of online monitored machines in the plant in order of health status, with the most severe appearing first. This pie chart is based on the current machine status.
How your Dashboard is filtered determines whether this pie chart represents online monitored machines from a single plant or from all of your plants.

This element graphs the number of machines with Serious and Extreme statuses over the past year.
It only includes machines from which data is manually collected with a TRIO and is based on Analyst Reviewed Results.
Mouse over any plotted point to see the severity level and the number of machines in that state for that month.

Click this element's title bar to see the last seven statuses for each machine that has had a Serious and Extreme status during the past year. If there have not been at least seven analyst reviews for a machine, you will see fewer bars.
If your Dashboard is filtered to show a particular plant, the name of that plant appears at the top of the list. If the Dashboard is filtered to All Plants, you will not see a plant name (as pictured below).

This element graphs the number of machines with Moderate, Slight, and No Fault statuses over the past year.
It only includes machines from which data is manually collected with a TRIO and is based on Analyst Reviewed Results.
Mouse over any plotted point to see the severity level and the number of machines in that state for that month.

Click this element's title bar to see the last seven statuses for each machine that has had a Moderate, Slight, and No Fault status during the past year. If there have not been at least seven analyst reviews for a machine, you will see fewer bars.
If your Dashboard is filtered to show a particular plant, the name of that plant appears at the top of the list. If the Dashboard is filtered to All Plants, you will not see a plant name (as pictured below).

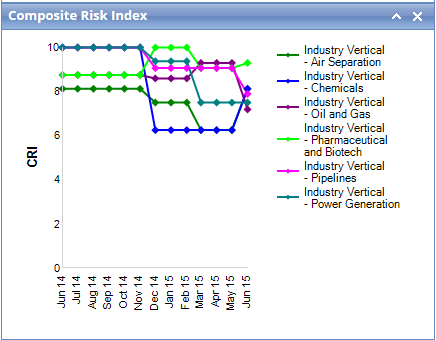
The Compound Risk Index (CRI) element shows the amount of operational risk to production associated with the continued operation of your machines based on the severity of their faults.
Click the Compound Risk Index link in the title bar to open a CRI report that shows the operational risk to production associated with the continued operation of a the machines in your plant.
Important! This element requires an operational significance be specified for each machine, which is done via ExpertALERT. If you are a WATCHMAN Service customer, your Azima analyst will enter the information you provide. An operational significance of 1 means the machine has little to no impact on your program; 10 means the machine is extremely critical to production. If you do not specify operational significance, do not add this element to your Dashboard because it will not provide any meaningful results.
You can also create a custom CRI Report containing only the machines you want via the Create Custom Report menu. For more details, see Creating Custom Reports.
The Derived Machinery Readiness element shows the overall readiness of the machines in your plant. Readiness is represented by a percentage—the higher the percentage the more ready the fleet. The DMR rating takes into account the number of faults reported for each machine, the severity of those faults, and the importance of each machine to production.
Click the Derived Machinery Readiness link in the title bar to see a DMR report summarizing the overall readiness of your fleet.
Important! This element requires an operational significance be specified for each machine, which is done via ExpertALERT. If you are a WATCHMAN Service customer, your Azima analyst will enter the information you provide. An operational significance of 1 means the machine has little to no impact on your program; 10 means the machine is extremely critical to production. If you do not specify operational significance, do not add this element to your Dashboard because it will not provide any meaningful results.
You can also create a custom DMR report containing only the machines you want via the Create Custom Report menu. For more details, see Creating Custom Reports.

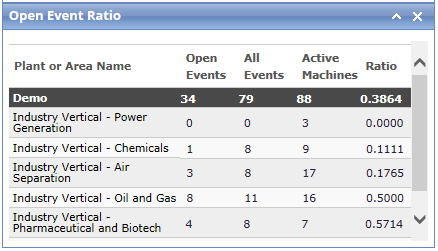
The Open Event Ratio element shows the ratio of open-event faults to active machines. Open events are recommendations that have been identified by an analyst within the last 365 days and have a status of “Open” in the Event Tracker. A low number indicates efficient machine repair practices, consistent data collection techniques, and rapid resolution of identified issues.
If you do not use the Event Tracker to track repairs and confirm analyst findings, do not add this element to your Dashboard as it will not display any meaningful information.
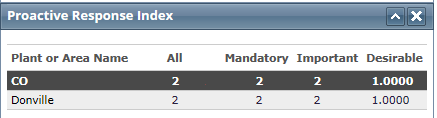
This Proactive Response Index element shows the completion rate of analyst-recommended actions within 60 days of reporting, sorted by level of urgency. The score is affected by fixing machine problems and retesting after repair—the sooner the actions are taken, the higher the score.
Only Recommended Actions from the past 180 days are included.
If you do not use the Event Tracker to track repairs and confirm analyst findings, do not add this element to your Dashboard as it will not display any meaningful information.
 .
.
The Event Tracker Summary element provides a snapshot view of the number of repair recommendations in the Event Tracker, sorted by level of urgency. The information in the Event Tracker is populated when an analyst confirms a fault for a machine.
If you do not use the Event Tracker to track repairs and confirm analyst findings, do not add this element to your Dashboard as it will not display any meaningful information.
![]()
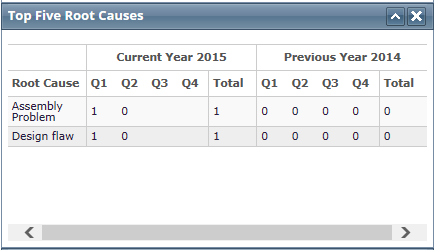
The Top Five Root Causes element shows the five most frequently reported root causes across your program. The data is presented in a quarterly and annual view. The information comes from what you enter in the Event Tracker when you confirm the root cause of called faults.
If you do not use the Event Tracker to track repairs and confirm analyst findings, do not add this element to your Dashboard as it will not display any meaningful information.
This element becomes more meaningful faults are confirmed over time. If there are not five root causes listed (as in the image below), it means there have not yet been five different faults detected.
The Average Time to Repair element shows the average time it took to repair a fault based on the initial date of reporting and latest priority stored in the Event Tracker.
If you do not use the Event Tracker to track repairs and confirm analyst findings, do not add this element to your Dashboard as it will not display any meaningful information.

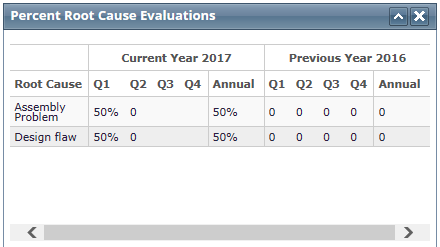
The Percent Root Cause Evaluations element displays the root causes that occur most frequently as a percentage. It is based on the information you enter via the Event Tracker. This information can help you can identify maintenance issues, such as improper lubrication, temperature problems, etc.
If you do not use the Event Tracker to track repairs and confirm analyst findings, do not add this element to your Dashboard as it will not display any meaningful information.
This element graphs the number of online monitored machines with Serious and Extreme statuses over the past year.
It only includes machines from which data is automatically collected via the WATCHMAN Online System and is based on the current machine status.
Mouse over any plotted point to see the severity level and the number of machines in that state for that month.

Click this element's title bar to see the last seven statuses for each online-monitored machine that has had a Serious and Extreme status during the past year. If there have not been at least seven months in which there was at least one test for a machine, you will see fewer bars. If your Dashboard is filtered to show a particular plant, the name of that plant appears at the top of the list. If the Dashboard is filtered to All Plants, you will not see a plant name.
This element graphs the number of online monitored machines with a Moderate, Slight, and No Fault statuses over the past year.
It only includes machines from which data is automatically collected via the WATCHMAN Online System and is based on the current machine status.
Mouse over any plotted point to see the severity level and the number of machines in that state for that month.

Click this element's title bar to see the last seven statuses for each online-monitored machine that has had a Moderate, Slight, and No Fault status during the past year. If there have not been at least seven months in which there was at least one test for a machine, you will see fewer bars. If your Dashboard is filtered to show a particular plant, the name of that plant appears at the top of the list. If the Dashboard is filtered to All Plants, you will not see a plant name.
The Synchronization Activity element shows the last time each subscription database synchronized (replicated) to the ExpertALERT-Cloud master database and whether there are any pending messages from the master.
The synchronization process is a two-way operation. Subscription databases, such as the database on a TRIO, sync and send collected data to ExpertALERT-Cloud. "Messages" from ExpertALERT-Cloud, such as a change to the phase collection settings for a location, are pulled down to the subscription.
If the Pending Messages column shows anything other than zero, it is an indication that the database needs to synchronize/replicate.
This element is very helpful for facilities with multiple TRIOs.

The Operational Risk Assessment shows the machines with the highest operational risk to production based on the faults detected and how critical the machine is to production. The closer the machine is to 10, the higher the risk.

This element tracks the savings your plants are realizing due to the early detection of machinery faults. By repairing faults before they escalate to failure, your maintenance department spends less on replacement parts, overhauls, overtime, etc. The calculations are based on general industry estimates.
Among the factors considered are:
Severity of the detected faults at your plants
Likelihood of equipment failure if faults were not detected
Replacement and overhaul costs
Additional substantial financial considerations not directly considered include overtime labor and production loss costs associated with repairs and downtime
