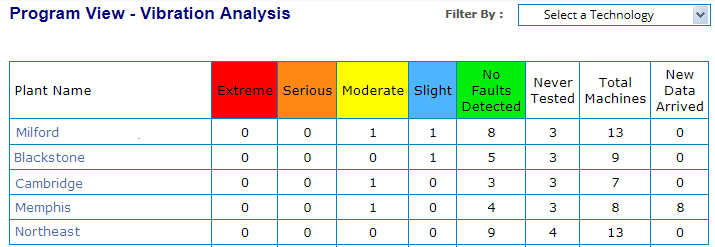
The Program View page provides an overview of the equipment monitoring taking place across your company. However, only the plants to which your login has permission appear. Click here to see how to access the Program View page.
Tip! You can specify that this page be your default home page when you log into the Portal (instead of the Dashboard page).
Each of your plants is listed in a table showing the number of machines in each state of health, based on the last analyst review of data.
Machines with a severity level of Extreme and Serious are given equal weight. This means a plant with three Serious machines and no Extreme machines will be higher in the table than a plant with two Extreme machines and no Serious machines.
The status shown is always based on the last analyst review. If new data has been collected, but not reviewed by an analyst (even if it has been run though the expert system),it is not reflected in the status shown in this table.
Tip! The New Data Arrived column shows the number of machines in the plant with new data pending review. This provides a clear picture of whether none, some, or all machines are awaiting analyst review, or whether the status shown is truly the most recent information.
Click a plant name in the table to learn more about the monitoring at that plant via its Plant View page.
You can sort the table in a variety of ways, depending on what you want to see. However, if you refresh the page, the sort returns to its default "by severity" display.
To sort the table alphabetically, click the Plant Name column head. The first time you click it, plants are ordered alphabetically from A-to-Z; click it again to order from Z-to-A.
Click any status column head (Extreme, Serious, Moderate, Slight, No Faults Detected, Never Tested) to sort the plants by the number of machines with that particular status. Click once to put the highest number at the top; click again to sort ascending from 0.
The Total Machines and New Data Arrived columns can be sorted in ascending or descending order based on the number of machines.

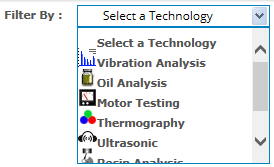
If your program involves multiple technologies (such as, oil and IR) and reports are posted for those technologies, you can filter the Plant Summary table to show only plants with specific technology reports. If there are no technology reports, you will not see the Filter By drop-down list.

For example, select Oil Analysis to filter the table to show only plants that have at least one oil report posted. Only technologies for which reports have been posted to a technology User-Defined Point appear in the drop-down list.

If you want to see more information (for example, some machines at one of your plants have an overall status of Extreme), you can do any of the following:
Use the Navigation Section to drill down to the plant, area, or machine you are interested in learning more about and review the information displayed in the Main Section and/or view the associated reports that appear in the Reports Section.
From the Reports Section, click Recent Reports in Database to see the 20 most recent reports posted to the Portal across all of your plants.
From the Reports Section, click Machines in Database by Severity to see all of your machines across all of your plants in order of severity, with those with faults deemed Extreme appearing first.
From the Reports Section, click Overdue Machines in Database to see a list of all machines in your entire database for which new data has NOT been uploaded within its specified collection period. Machines that are the most overdue for collection are listed first.
From the Reports Section, click Event Tracker in Database to see the actions recommended by your analyst for all of your machines across all of your plants. All pending recommendations appear in the list.
Note: In all cases, you will only see information about plants/areas to which your login has permission.