The Navigation Section shows the plants involved in your monitoring program. Depending on the size of your company and the breadth of your monitoring program, there could be one or many plants listed here.
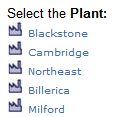
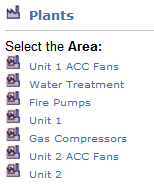
Click the name of a plant and the Navigation Section changes to show a list of the areas within this plant.
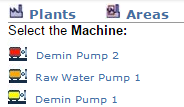
Click the name of an area and the Navigation Section changes to show a list of the monitored machines in that area. Machines are listed in order of their health status, with those deemed Extreme first. The status shown is based on the most recent analyst review (Analyst Reviewed Results). If a machine is gray, it means there is new data awaiting review by your analyst.