The WATCHMAN Reliability Portal comes with two customizable Dashboards that enable you to display the information that is most important to you and your reliability program.
Azima has created more than a dozen Dashboard elements that provide key information and at-a-glance reliability metrics. Click here for a description of the available elements.
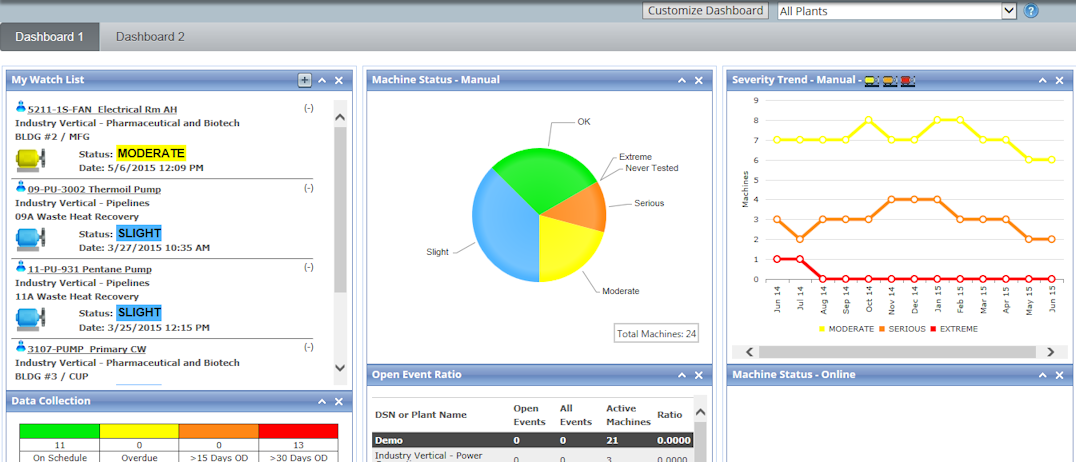
By default, the most popular elements are shown on Dashboard 1. However, both Dashboards are fully customizable, so you can adjust them to meet your program's needs.
A drop-down list in the upper right of the page dynamically filters the Dashboards to show information about a single plant or by all plants in your program. (The My Watch List element is the only exception. It always shows the machines you added to it, regardless of what is selected from the filtering drop-down list.)
Things to know about the Dashboards:
When you log in to the WATCHMAN Reliability Portal, Dashboard 1 is the default home page. However, if you prefer to see the Program View page first, you can specify it as your default home page in your preferences.
To return to Dashboard 1 from any Portal page, choose View>Dashboard. You can also click the WATCHMAN Reliability Portal logo (or your company logo if you have a customized Portal) in the upper left of any Portal page to return to Dashboard 1. (If you changed your default home page to Program View, clicking the logo in the upper left will open the Program View page and not the Dashboard.)
Dashboard 1 always displays first; you must toggle to Dashboard 2 by clicking its tab. To ensure this is not an issue, customize Dashboard 1 to include the elements that are most important to you.
For most elements, you can click the heading/title bar to see more information. For example, click the heading of the Machine Status - Manual element to see a list of all manually monitored machines represented in that pie chart in order of severity. If the Dashboard is filtered to a single plant, it shows machines in that plant. If All Plants is selected from the drop-down list, machines across all of your plants are included.
You do not have to use all of the available elements.
The Dashboard 2 tab is always visible, but there is no requirement to use it.
You only see information about the plants and areas to which your login has permission. This means that if you select All Plants, information only appears for the plants (and the areas within those plants) to which your login has permission. If you select a particular plant from the drop-down, you will only see information for the areas to which your login has permission.