The WATCHMAN Reliability Portal comes with two customizable Dashboards that enable you to display the information that is most important to your reliability program.
Specifying the information you want on each Dashboard is done via a simple interface and drag-and-drop process through which you can add, delete, and reposition pre-defined elements (for example, a Watch List of your most critical assets).
The two Dashboard views are labeled as Dashboard 1 and Dashboard 2. You can toggle between them by selecting the appropriate tab.
Important! You do not have to use both Dashboards, nor are you required to customize either one. When you choose View>Dashboard from the main toolbar, Dashboard 1 always appears first. You must select the Dashboard 2 tab to switch to the second dashboard. If you do not customize either Dashboard, Dashboard 1 displays the most popular elements by default.
When you customize one or both Dashboards, the view you set is unique to your login. Each user can set up the Dashboards to his or her own liking.
To customize the Dashboards
From the top tool bar, choose View>Dashboard or click the WATCHMAN Reliability Portal logo at the top left of any WATCHMAN Reliability Portal page. (If you have a customized Portal, your company's logo will be in place of the WATCHMAN Reliability Portal logo.)
Click the Customize Dashboard button.
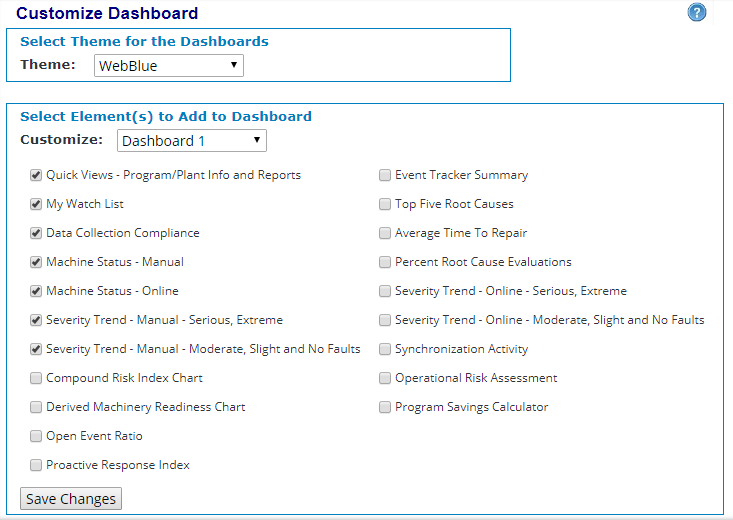
In the Customize Dashboard window, do the following:

From the Theme drop-down list, select the style you want for the Dashboard. (You may want to try different ones to see what you like best.)
From the Customize drop-down list, select either Dashboard 1 or Dashboard 2 to specify which Dashboard you are customizing.
In the Select Element(s) to Add to Dashboard section, select the check boxes for the elements you want to see on the specified Dashboard. Each element is described in the Dashboard Elements topic.
Click the Save Changes button to apply your selections.
Note: When you are just starting your WATCHMAN Service program, some elements are blank or only show minimal information. As your program matures, the elements automatically populate with information and become more meaningful.
Once you have added the elements you want to each Dashboard, you can drag and drop them to where you want them on the page.
To do this, mouse over the title bar of the element until you see a four-headed arrow, then simply drag the element to where you want it.